
Find your category, compare yourself to the pros, fine-tune your training
Understanding power in cycling
In cycling, power, measured in watts, has become an essential performance metric. It reflects the energy a rider puts out at any given moment. But what does that number actually mean, and why does it matter so much? It’s not just about speed: it’s about the effort it takes to hold that speed. Let’s break down this fundamental concept.
What is power in watts?
Imagine pushing a heavy crate across a flat floor. Power is the energy you spend moving that crate a given distance in a given amount of time. The harder and faster you push, the higher your power. Cycling works the same way: power measures the effort you put into driving the bike forward. Many factors affect that effort, such as the force you apply to the pedals, your cadence and the resistance you face (wind, gradient and so on).
Absolute vs. relative power: a key difference
It’s essential to tell absolute power (in watts) apart from relative power (in watts per kilogram of body weight – W/kg). The first is the raw output you produce, while the second factors in the rider’s weight. That’s why a lighter rider can shine in the mountains despite producing fewer watts than a heavier rider who’s strong on the flats: there’s simply less weight to haul up the slope.
Take an example: a 60 kg rider producing 300 watts has a relative power of 5 W/kg, while an 80 kg rider producing the same absolute power sits at 3.75 W/kg. For the climber, every watt is therefore more “effective” on the way up. Cycling power estimates often rely on mathematical models that take several parameters into account, such as the rider’s weight, average speed and the gradient.
Here’s a summary table of watts by level:
Cycling power chart by rider level
| Level | Absolute power (W) | W/kg (70 kg) | Estimated FTP |
|---|---|---|---|
| Beginner | 100–150 W | 1.4–2.1 W/kg | 90–130 W |
| Recreational rider | 150–220 W | 2.1–3.1 W/kg | 130–190 W |
| Regular trained rider | 220–300 W | 3.1–4.3 W/kg | 190–260 W |
| Amateur racer | 300–380 W | 4.3–5.4 W/kg | 260–330 W |
| Elite / Pro | 380–500 W+ | 5.4–7.1 W/kg | 330–450 W+ |
Improving your power: first steps
Now that power makes more sense, how do you improve it? Structured training built around power zones is the key to lasting progress. That’s what we’ll cover in the next section.
Understanding cycling power zones
Knowing your power in watts is one thing; using it to structure your training is another. To progress and reach your goals, whether that means building endurance, getting faster or climbing better, you need to understand and master the concept of power zones. These zones split the power you can produce into several intensity levels, each with specific effects on your body.
To set them properly, you first need to know your FTP (Functional Threshold Power), the average power you can sustain for one hour. Your FTP is the basis for calculating the different zones. Tools like BikeCompanion let you enter it to calculate your zones (a PRO feature) and record your data.
Here’s a summary of the 7 power zones and their characteristics:
The 7 cycling power zones
Table showing the different power zones, their percentage of FTP, how each one feels and the specific benefits of each zone
| Zone | % of FTP | How it feels | Typical duration | Benefits |
|---|---|---|---|---|
| 1 (Active recovery) | < 55% | Very easy, like a stroll | Long | Recovery, better blood circulation |
| 2 (Endurance) | 56–75% | Easy, you can hold a conversation | Long (2–3 h) | Builds endurance, uses fat as fuel |
| 3 (Tempo) | 76–90% | Moderate effort, talking gets hard | Medium (1–2 h) | Improves your ability to sustain moderately hard efforts |
| 4 (Threshold) | 91–105% | Hard, no more talking | Short (8–12 min per interval) | Raises your FTP |
| 5 (VO2 max) | 106–120% | Very hard, intense effort | Very short (3–8 min) | Builds your ability to produce intense efforts over short durations |
| 6 (Anaerobic capacity) | 121–150% | Extremely hard, explosive effort | Very short (30 s – 3 min) | Improves speed and maximum power |
| 7 (Neuromuscular) | > 150% | All-out, sprint | Very short (< 30 s) | Pure power work |
This table gives you an overview of the zones and what each one is for. Keep in mind that these percentages are general guidelines.
Personalizing your training with power zones
It’s important to adapt power zones to your own profile and to how you feel. Testing your FTP regularly will help you fine-tune these zones and track your progress. Individualization is the key to optimal training.
Practical examples of using the zones
- Build endurance: A long 2- to 3-hour ride in Zone 2 is ideal for building your aerobic base.
- Raise your FTP: 8- to 12-minute intervals in Zone 4, with recovery periods in Zone 1 or 2, specifically target your threshold.
- Work on your sprint: Repeated 10- to 20-second sprints in Zone 7, with full recovery between efforts, improve pure power.
By adapting these examples and using power zones wisely, you can structure your training and progress more efficiently. Listening to your body and adjusting intensity based on how you feel remain essential.
Training methods to boost your cycling power
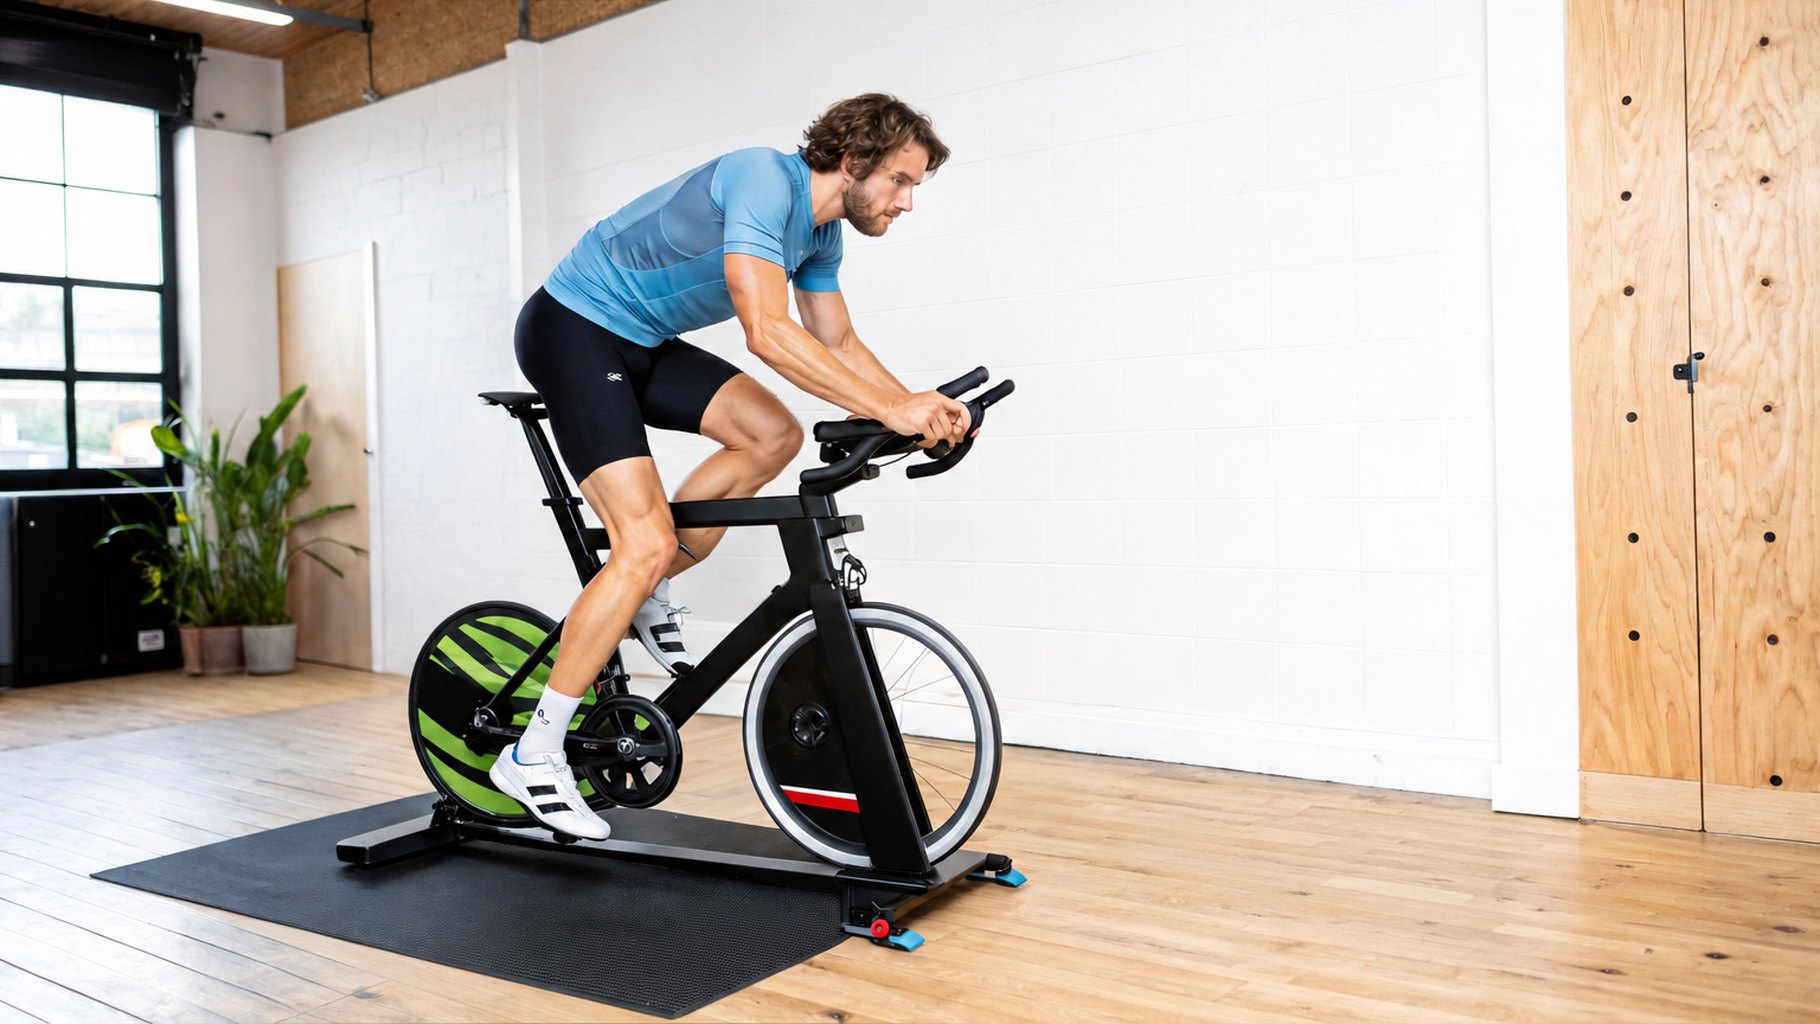
Once you’ve identified your power zones, it’s time to use them to get better. The idea that only long, low-intensity rides pay off needs rethinking. Well-structured high-intensity intervals are far more effective at triggering the physiological adaptations that increase your power.
Why high-intensity intervals matter
High-intensity intervals, done in Zones 4 to 7, work your energy systems more effectively than long endurance rides. They develop both your aerobic capacity (endurance) and your anaerobic capacity (short, intense efforts). This type of training drives significant physiological adaptations, particularly in your muscles and cardiovascular system, which translate into more power.
Structuring your training to maximize your cycling power
To maximize your power gains, build variety into your training week. Here are a few examples:
- Sprints: 10- to 30-second sprints in Zone 7, with full recovery in between, develop your maximum power and explosiveness.
- Hill repeats: Pick a moderately difficult climb and do 3- to 8-minute repeats in Zone 5 (VO2 max) to climb better.
- Sustained threshold efforts: Ride in Zone 4 for 8 to 20 minutes, with recoveries in Zone 2, to hold high power for longer.
The Vingegaard/Pogačar duel at the 2023 Tour de France showed how much sustained high power matters. Vingegaard averaged 447 watts over seven climbs, 5.4% more than in 2022 (424 watts for efforts of around 30 minutes). Pogačar, for his part, often went above 6.5 watts per kilogram when attacking. These numbers show how effective targeted training can be.
Matching your training to your cycling goals
The sessions above are suggestions. Adapt your training to your goals. Time trials? Focus on sustained threshold efforts. Sprinter? Concentrate on sprints and strength.
Tracking your progress with an app like BikeCompanion
BikeCompanion lets you track your power with a Bluetooth power meter and analyze your training data. With the PRO version (free trial available), see your power zones and the time spent in each one. Adjust your training and watch yourself improve. Lasting progress depends on consistent training, good recovery and proper nutrition. A tool like BikeCompanion makes tracking and analysis easier.
Improving your cycling power inevitably comes down to training. But there’s another aspect that’s just as important: recovery. That’s when your body regenerates and absorbs the work you’ve done. Optimal recovery is the key to lasting power gains. Conversely, too little rest can lead to overtraining and a drop in performance.
Recovery and supercompensation
Supercompensation is the process by which the body repairs and strengthens itself after exercise. Training followed by proper recovery prepares your body for a harder effort. This principle is the foundation of progress in cycling.
Productive fatigue vs. overtraining
It’s essential to tell the difference between productive fatigue, a normal response to effort, and overtraining. Several signs can point to overtraining: persistent fatigue, lingering muscle soreness, low motivation and declining performance. The BikeCompanion app can help you track your performance and spot when it drops.
Optimizing your recovery
Here are a few ways to optimize your recovery:
- Active recovery: Light activity, such as an easy Zone 1 ride or a walk, boosts blood flow and helps clear metabolic waste.
- Passive recovery: Complete rest, lying down, lets your body regenerate deeply.
- Compression: Wearing compression garments can improve circulation and reduce muscle soreness.
- Sleep: Quality sleep, 7 to 9 hours a night, is fundamental for muscle and hormonal recovery.
- Nutrition: A balanced diet rich in protein and carbohydrates replenishes your energy stores and supports muscle repair.
Monitoring your recovery
Several indicators can help you assess how well you’ve recovered:
- Resting heart rate: An elevated resting heart rate can be a sign of incomplete recovery.
- Heart rate variability: Low variability can indicate fatigue.
- How you feel: Listening to your body and adjusting your training to your fatigue level is essential.
By combining these methods and monitoring these indicators, you can optimize your recovery and maximize your power gains. Remember: recovery is an integral part of training and essential for lasting progress.
Managing the external factors that affect your power
In cycling, the power you produce doesn’t depend only on training and recovery. Your environment plays a major role and can strongly influence how many watts you put out. Understanding the impact of altitude, temperature and humidity is crucial to interpreting your data correctly and adjusting your targets.
Altitude: a direct impact on power
Altitude lowers air pressure and the amount of available oxygen. This directly affects energy production and therefore power. Your body has to adapt to this oxygen-poor environment. Take a Tour de France stage as an example. Tadej Pogačar produced a standardized power output of 473 watts. However, at an average altitude of 1,725 meters (5,659 ft), this performance is equivalent to roughly 490 watts standardized at 1,000 meters (3,281 ft), because the thinner air cost him almost 4% of his power. Altitude therefore affects apparent power.
Temperature and humidity: important factors
Temperature and humidity also affect power. In hot weather, your body works harder to regulate its temperature, which reduces the power available for the effort. High humidity amplifies this effect by making sweating less effective.
Adapting to outside conditions
Fortunately, there are ways to adapt to these conditions. At altitude, gradual acclimatization is a must. Increase the altitude of your training little by little. In heat and humidity, good hydration and adjusting the intensity of your efforts are essential. Don’t hesitate to ease off your training when it’s very hot.
Analyzing your data with the environment in mind
The BikeCompanion app records your power data along with the altitude and weather of your ride (temperature, wind). That way you can analyze your performance objectively, without getting discouraged or overestimating yourself because of changing conditions.
Adaptation examples
- In the mountains: Allow a few days to acclimatize before going hard at high altitude.
- In hot weather: Lower your power targets and favor shorter, less intense rides. Drink regularly.
- In humid conditions: Wear breathable clothing to help sweat evaporate.
By factoring these external conditions into your power analysis and adapting your training, you’ll keep progressing whatever the conditions. Understanding the impact of your environment is the key to improving your cycling power over the long term.
Improving your cycling power: why nutrition matters
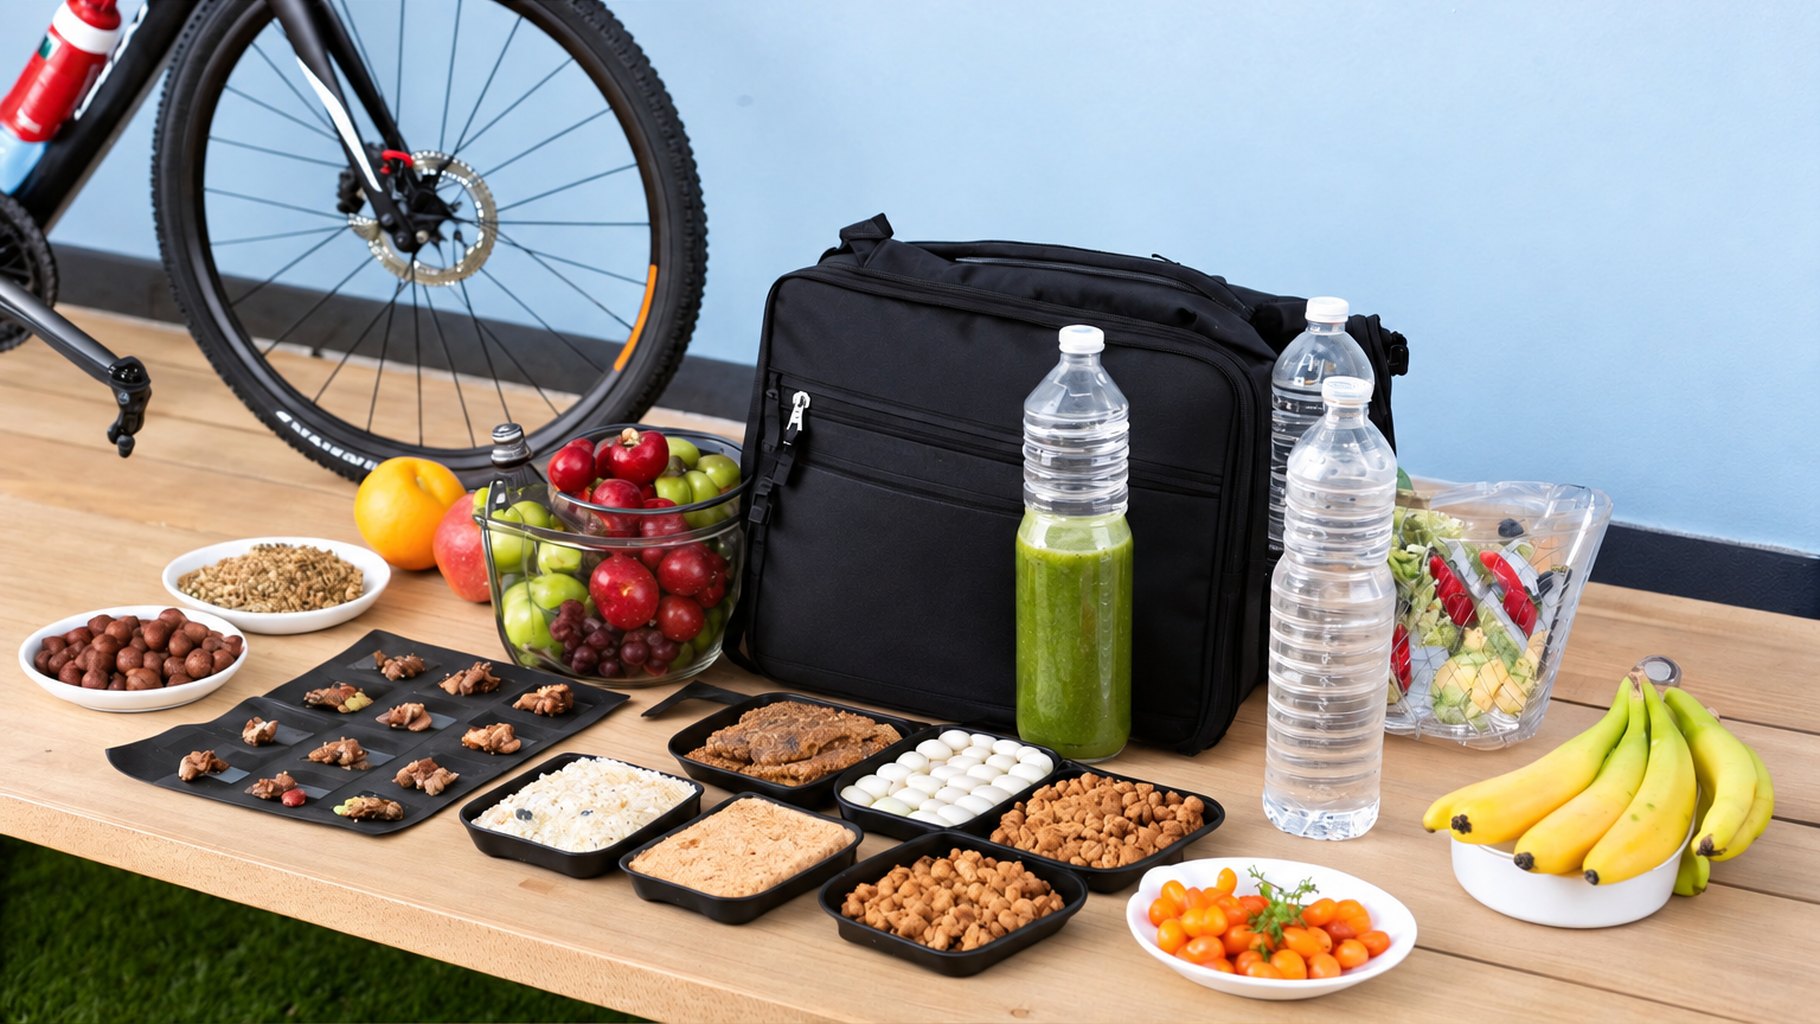
To optimize your cycling power and answer the question “how do I improve my power?”, training is essential, of course, but it isn’t enough. Diet plays a key role in your ability to produce watts. Your performance is directly tied to what you eat. Let’s see how strategic nutrition can boost your power on the bike.
Matching your diet to your training
Taking a page from pro team nutritionists can make all the difference. Timing your nutrition around your different types of training is crucial. Before a long endurance ride, favor complex carbohydrates, such as whole-wheat pasta, for long-lasting energy. After an intense session, eating protein will support recovery and muscle repair.
Supplements: a power boost?
Some supplements have a scientifically proven positive effect on performance and power output. Creatine, for example, can improve power during short, intense efforts. Caffeine can also boost performance. However, it’s important to respect the right dosage and timing for each supplement.
To help you see more clearly, here’s a comparison table:
Supplements and their effect on cycling power: comparison of different supplements, their proven effectiveness, recommended dosage and best timing
| Supplement | Effect on power | Recommended dosage | Best timing | Precautions |
|---|---|---|---|---|
| Creatine | Improves power and strength | 3–5 g/day | After training | Stay well hydrated |
| Caffeine | Stimulant, improves performance | 3–6 mg/kg of body weight | 1 hour before exercise | May disrupt sleep |
| Beta-alanine | Reduces muscle fatigue | 4–6 g/day | Before and after training | Possible tingling |
| Sodium bicarbonate (baking soda) | Improves performance during intense efforts | 0.3 g/kg of body weight | 1–2 hours before exercise | Possible digestive issues |
This table sums up the main supplements used to improve cycling power. Remember to consult a healthcare professional before adding supplements to your diet.
Sample meal plans
A meal plan tailored to your needs and your training is fundamental. Here are a few examples:
- Hard training day: Carb-rich breakfast (oatmeal), light lunch (mixed salad), dinner with protein and carbs (fish and rice).
- Rest day: Balanced diet with fruit, vegetables, protein and carbohydrates.
- Before a race: Carb-loading in the days leading up to the race maximizes your energy stores.
The BikeCompanion app estimates the calories you burn on every ride, a useful reference for matching your diet to your training.
Personalizing your nutrition
These examples are starting points to adapt to your profile and goals. Consider seeing a sports nutritionist for a personalized plan. Optimized nutrition, combined with smart training and good recovery, will help you reach your full potential and significantly improve your cycling power.
Measurement technology for targeted progress
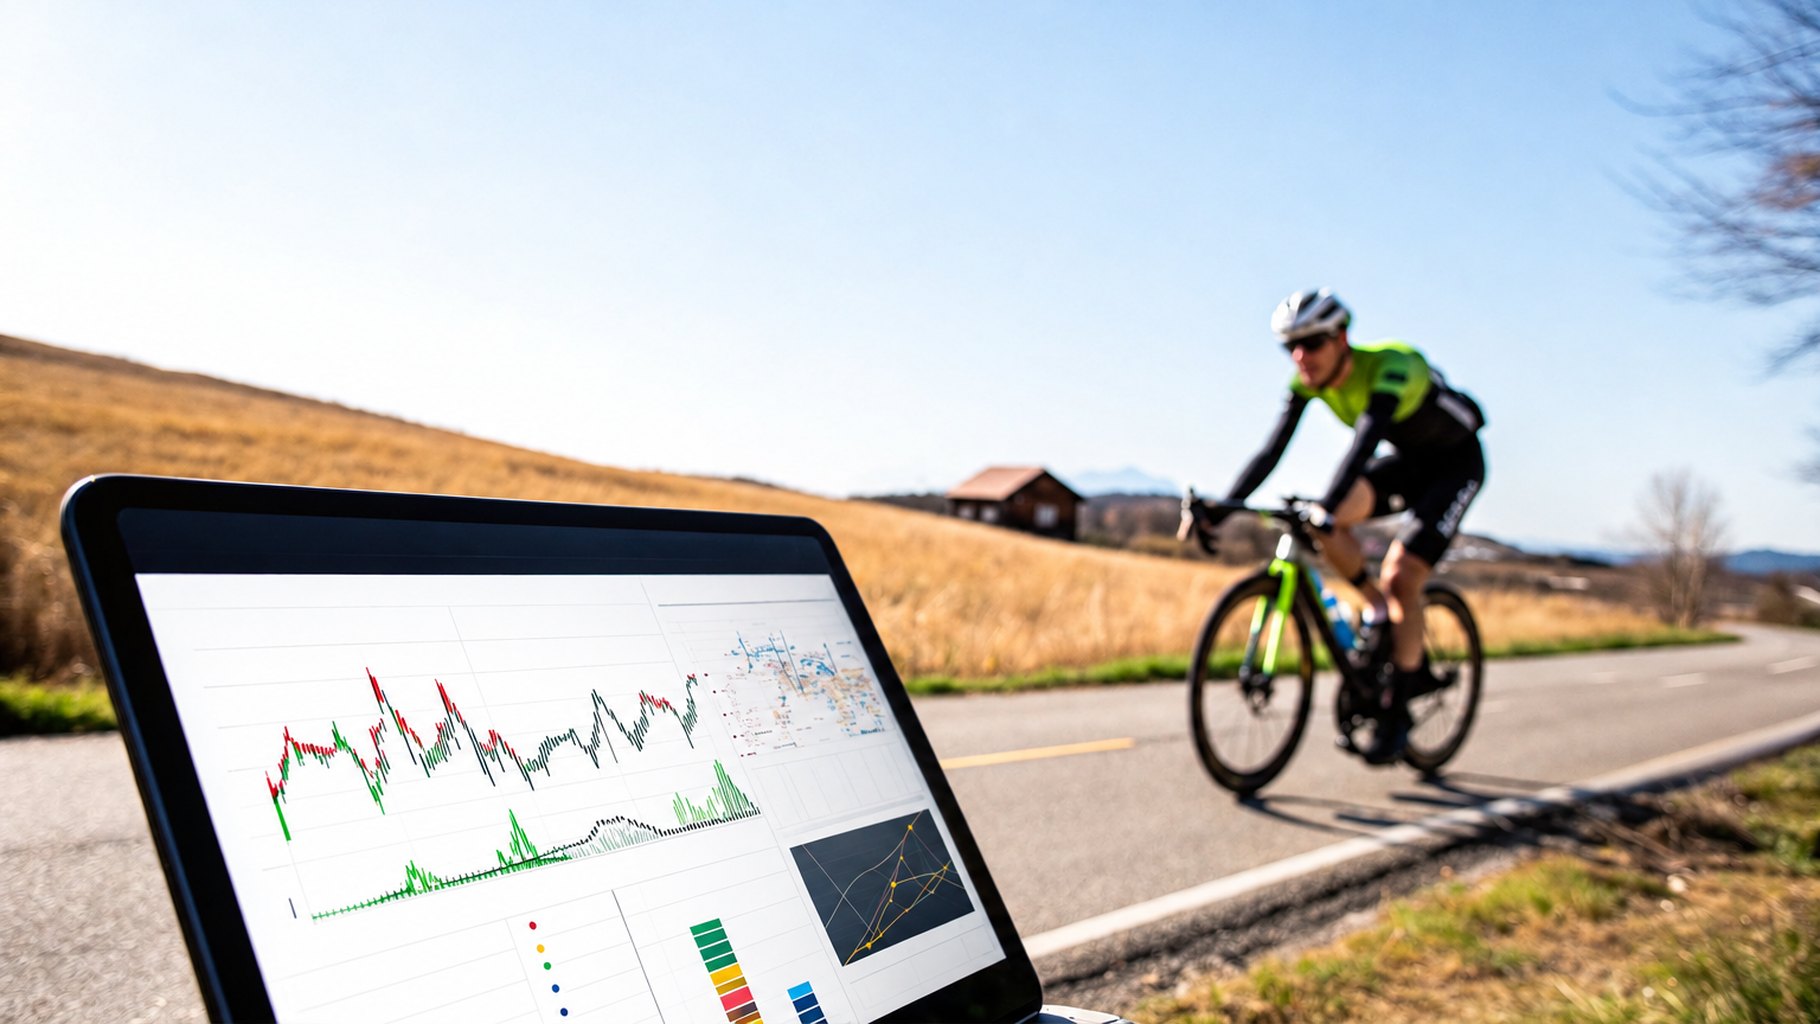
Improving your cycling performance starts with data analysis. That makes choosing a power meter crucial. Pedals, cranks or hub: each technology has its own characteristics. It’s important to understand them so you can choose the tool that best fits your needs and budget.
Pedal-based power meters
Accuracy is a major strength of pedal-based power meters. They can measure each leg’s power individually. That information is valuable for spotting imbalances and optimizing your pedal stroke. They’re easy to install and easy to move from one bike to another. One caveat, though: they’re exposed to impacts and wear.
Crank-based power meters
Sturdier and less exposed to impacts than pedal-based meters, crank-based power meters also offer good accuracy. They’re often more affordable. On the other hand, they usually can’t measure each leg’s power separately. Installation can also be trickier.
Hub-based power meters
Built into the rear wheel, hub-based power meters are easy to install and discreet. They’re generally attractively priced. However, their accuracy can be slightly lower than that of pedal or crank meters. They also don’t measure power per leg, and switching bikes means switching wheels.
Power meter technologies compared
| Technology | Accuracy | Per-leg power | Durability | Ease of installation | Price |
|---|---|---|---|---|---|
| Pedals | Excellent | Yes | Good | Excellent | High |
| Cranks | Very good | Usually not | Excellent | Good | Medium |
| Hub | Good | No | Good | Excellent | Low |
Advanced metrics for deeper analysis
Beyond raw power, modern power meters offer advanced metrics:
- Left/right balance: Identify imbalances and strengthen your weaker leg. A perfectly even split isn’t necessarily the goal; variations of a few percent are common.
- Pedaling efficiency: Analyze how smooth your pedal stroke is. Better efficiency means better use of your energy.
- Normalized Power (NP): This metric accounts for variations in power to estimate the true physiological cost of a ride, which is especially useful for rides with big changes in intensity.
Interpreting this data is the key to optimizing your training. A large left/right imbalance can reveal a biomechanical problem. Low pedaling efficiency can be improved with specific drills. Normalized power lets you compare efforts made under different conditions.
By pairing the right power meter with careful data analysis, you can identify your weak points, adjust your training and progress efficiently. BikeCompanion lets you record your power and, with the PRO version, analyze your normalized power and zones for targeted progress. Find out how to get the most out of your power data and reach your goals.


